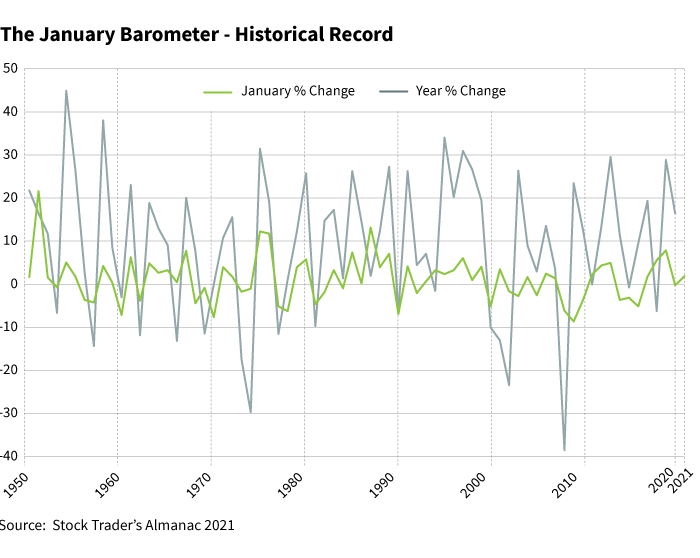
Devised by Yale Hirsch in 1972, the January Barometer states that as the S&P 500 goes in January, so goes the year. The indicator has registered 10 major errors since 1950, for an 85.7% accuracy ratio.
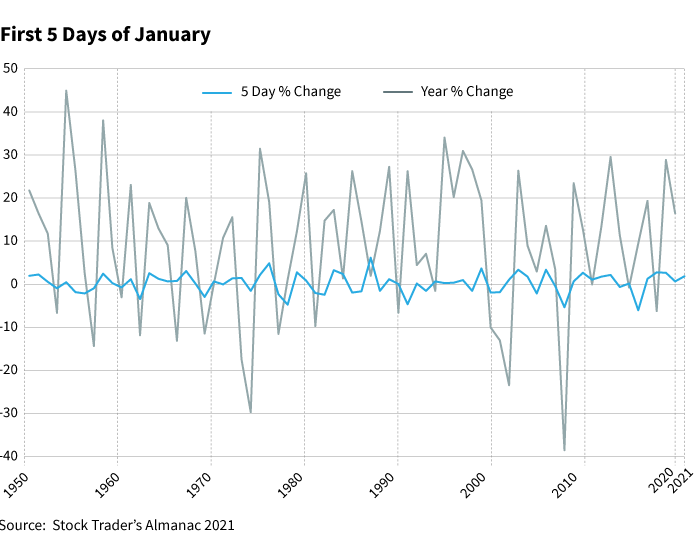
There are two parts to the January Barometer. The first part is the S&P 500 return in the first five trading days of January and its accuracy in predicting the S&P 500 return for the year. The Stock Trader’s Almanac refers to the first five days as the “Early Warning System.” The second part of the January Barometer is the S&P 500 return for the month of January and its accuracy in predicting the S&P 500 return for the year.
Table 1 contains historical return data for the S&P 500 in the first five days of January as well as annual returns. This is the “Early Warning System.” The last 46 times that the first five days had positive returns, the full-year return was positive 38 times, for an 82.6% accuracy ratio. The average S&P 500 gain was 14.3% in those years.

The second part is the S&P 500 return in January and the accuracy in forecasting the return for the year. In years when the S&P 500 had positive returns in the month of January, the average return for the year was 17.6%. The indicator has registered 10 major errors since 1950, for an 85.7% accuracy ratio.
Table 2 contains the monthly S&P 500 returns for January and the annual return S&P 500 returns:

Conclusion:
The last 45 times that the first five days have been positive (Early Warning System), the full-year return was positive 82.2% of the time, with average gains of 14.3% in those years.
Since 1950, in years when the S&P 500 had positive returns in the month of January, the full year was positive 85.7% of the time, with average gains of 17.6%.
The views and opinions expressed are those of the author, are subject to change with market conditions and are not meant as investment advice.
For informational purposes only. Not an investment recommendation.
324788
More in: Active Insights


