
In today’s post-housing bubble environment, the long-awaited recovery has failed to build a solid foundation. The high unemployment rate, declines in household income, and significantly tighter credit conditions have left both existing and new home sales close to recessionary levels in the United States.
Nevertheless, the outline of improved housing demand may be slowly taking shape. The key data point in this regard is the household formation rate, which we believe may have reached a historically significant low.
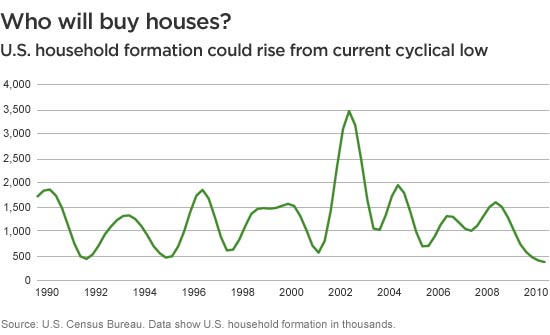
A brief history of U.S. household formation
Household formation has moved cyclically for the better part of the past two decades, from a rate of 500,000 per year at the low end to 1.7 million at the high end, with the notable exception of the recent housing boom, when household formation rose at a seasonally adjusted annual rate of 3.5 million as shown in the graph above. This was more than a case of needing to replace obsolete supply: Approximately 200,000–300,000 homes are built each year to replace aging units; but new homes were built at a rate of approximately 1.5 million per year in the 10 years leading up to 2006.
Jumping forward to today, household formation has fallen below the levels that emerged in the recent housing bust. In the past three years, the rate has dropped from 1.7 million units per year to below 500,000 currently. As unemployment remains historically high — particularly youth unemployment, which in the United States is above 18% among 15- to 24- year-olds* — a growing segment of the population is delaying its earliest ventures into the housing market. As more twenty-somethings remain in their parents’ homes or stay with roommates longer before heading out on their own, the bottoming household formation rate begins to anticipate pent-up demand for housing.
*Source: The Economist.


More in: Macroeconomics, Outlook