
- In assessing a company’s environmental impact, standard data disclosures like greenhouse gas (GHG) emissions and carbon intensity offer important insights.
- For our funds, we do an in-house analysis of a company’s carbon intensity, considering its rate of change and magnitude of improvement.
- Putnam believes engagement with companies in the midst of strategic shifts is one way for an active manager to have impact.
The following is excerpted from the Sustainability and impact report of Putnam Sustainable Leaders Fund and Putnam Sustainable Future Fund, authored by Putnam’s Sustainable Investing Team and Katherine Collins, CFA, MTS, Head of Sustainable Investing.
The full report is available at Putnam.com
Carbon dioxide and other greenhouse gases (GHG) trap thermal radiation from the earth’s surface, sustaining natural life. However, human activities, such as burning fossil fuels, are increasing the concentration of greenhouse gases and leading to rapid increases in climate-related risks.
That’s why environmental impact is an important part of our sustainability analysis and a key focus of the UN’s Sustainable Development Goals:


The data involved is complex and nuanced, requiring interpretation
Carbon intensity, which measures the ratio of carbon emissions to revenues, is a key element of environmental efficiency and a focus of our 2019 Sustainability and Impact Report. Standard data disclosures like carbon intensity and GHG emissions offer insight for investors interested in sustainability, particularly when combined with company-specific context and an understanding of potential future change. For example, lower or decreasing carbon intensity means that a company is generating fewer emissions per unit of revenue, which is better for the climate than higher or rising carbon intensity.
Why you should consider sustainable investing
We believe ESG analysis adds to — and complements — our fundamental assessment of companies.
About this disciplined process
In mutual funds, the aggregate emissions data often depends heavily on sector allocation, as you would expect: Companies in utility and energy sectors inherently have higher direct emissions when compared with less energy-intensive sectors like healthcare or financials. When we assess potential investments in carbon-intensive sectors, a key consideration is our analysis of the rate of change in those metrics and the magnitude of improvement that we expect given individual company strategies.
What carbon measures show, and why
The carbon intensity measure shows the ratio of two types of emissions to revenues. Scope 1 emissions are direct emissions from owned or controlled sources, and scope 2 emissions are indirect emissions from the generation of purchased energy. The portfolio level score aggregates the company-level intensity measures for all held securities. This metric offers the benefit of normalizing for company size, but in doing so it necessarily obscures the absolute level of emissions, which is important when considering a company’s impact on our climate.

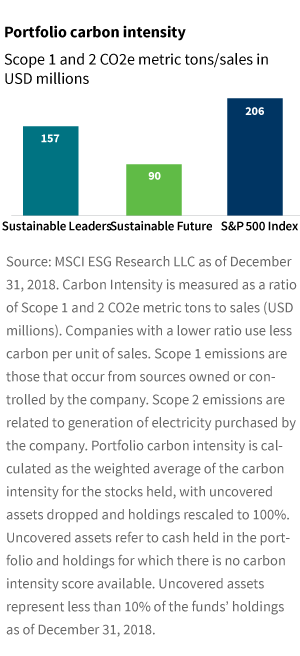
The carbon intensity of Putnam Sustainable Leaders Fund is somewhat lower (better) than the S&P 500, which we use as a representation of the broader market, and this metric is considerably lower (better) for Putnam Sustainable Future Fund. These metrics show positive, but not outstanding, differences versus the market. This is mainly because Putnam Sustainable Leaders Fund holds investments in two utilities (as of March 31, 2019). Despite their current fossil fuel use, these utilities are leading the way in replacing hydrocarbon-derived power generation with renewable energy generation.
How Putnam uses this measure
As active managers, we have the ability to selectively own and engage with companies that are actively committed to transitioning away from carbon-intensive energy sources. Therefore, when we assess potential investments in carbon-intensive sectors, a key consideration is our analysis for the future rate of change in those metrics and the magnitude of improvement that we expect given individual company strategies.
We do not explicitly exclude or screen out energy or utility holdings in our process, though it is unusual for companies in these sectors to meet our investment criteria.
For example, Putnam Sustainable Leaders Fund is invested in two utility holdings: AES Corporation and Nextera Energy. While these holdings made up less than 2% of the portfolio as of March 31, 2019, they constituted nearly half of the fund’s aggregate carbon intensity exposure. Why have we chosen to invest in these companies? Historical emissions data is useful, but it is inherently backwards-looking, while our investment research is forward-looking. Both AES and Nextera have meaningful strategies underway to reduce their carbon intensity, and we believe these plans are positive for the companies’ long-term financial prospects. The plans are also well aligned with the UN SDGs referenced above (#7 and #13).
A closer examination of the high carbon intensity of these two holdings illustrates our research philosophy: We recognize that historical data is most useful when it is linked to thoughtful projections of future performance, and that engagement with companies in the midst of strategic shifts is one way for an active manager to have impact. We will occasionally own companies with some poor current metrics if our research has convinced us of the potential for meaningful positive change.
Opportunities for future research and focus
We expect to see continued improvements in the accuracy, breadth, and timeliness of environmental data, which will provide new opportunities for relevant and accurate analysis. Many companies are just beginning to disclose environmental metrics and to set explicit goals for improvement, and others are moving forward with thoughtful and detailed climate change analysis; all of these developments will give investors more opportunity for analysis and engagement over time.
(As of March 31, 2019, AES Corporation and Nextera Energy accounted for 1.01% and 0.75%, respectively, of Putnam Sustainable Leaders Fund and Nextera Energy accounted for 1.75% of Putnam Sustainable Future Fund.)


More in: Sustainable investing