

- Market volatility in 2018 hit investors accustomed to the calm of 2017
- In fact, 2018 volatility was near the long-term average
- 2019 might feel similar to 2018 as many issues can spark ups and downs
2017 was a year in which nothing bothered markets. These conditions set the stage for an historic low-volatility environment, strong equity returns, and, as a result, strong risk-adjusted returns.
The picture began to change in 2018 when geopolitical risk, monetary policy, trade wars, inflation concerns, and an aging bull market all contributed to the return of normal volatility.
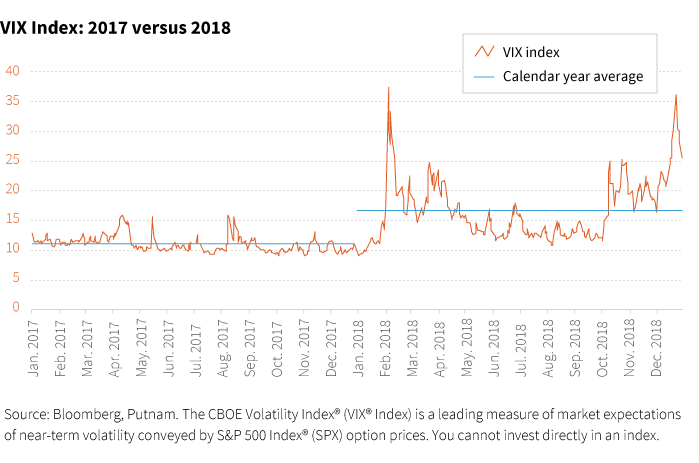
The VIX in perspective: 2017 vs. 2018
- In 2017, the VIX closed under 10 on 52 days
- In 2018, the VIX closed under 10 on 7 days, and all of them were in January
- In 2017, the high close for the VIX was 16.04
- In 2018, the high close was 37.32
- Also in 2018, the VIX had 113 closes higher than the 2017 high
- In 2017, the average VIX close was 11.09
- In 2018, the average VIX close was 16.64
- 2018 had 238 closes above the 2017 average
Investors have been feeling the volatility through the daily performance of the S&P 500.

Daily returns in perspective: 2017 vs. 2018
- 2017 had only 8 daily moves greater than 1% (four were positive and four were negative)
- 2018 had 64 daily moves greater than 1% (32 were positive and 32 were negative)
- 2017 had ZERO daily moves greater than 2%
- 2018 had 20 daily moves greater than 2% (5 were positive and 15 were negative)
These comparisons suggest 2018 was a volatile year. The reality is that 2018 was much more a reversion toward the mean — the average volatility levels seen over longer periods. Since 1990, the VIX average close is 19.26 and the median close is 17.39. In comparison, the 2018 average close of 16.64 is still below the long-term average. Since 1990, the S&P 500 has averaged 63 daily moves of 1% per calendar year, which is in line with the 64 that investors experienced in 2018.
2019 could look like 2018
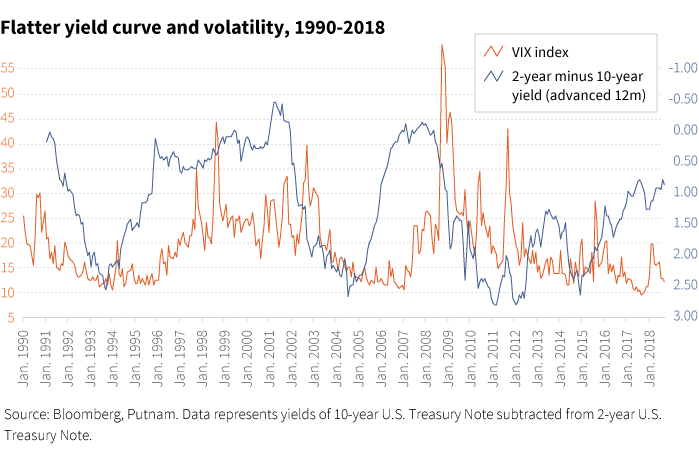
Moving forward into 2019, market volatility will likely persist at current levels, and may even be poised to increase. Three indicators signal this trend.
Historically, volatility tends to trend higher when the yield curve is flatter, and it is nearly flat today:
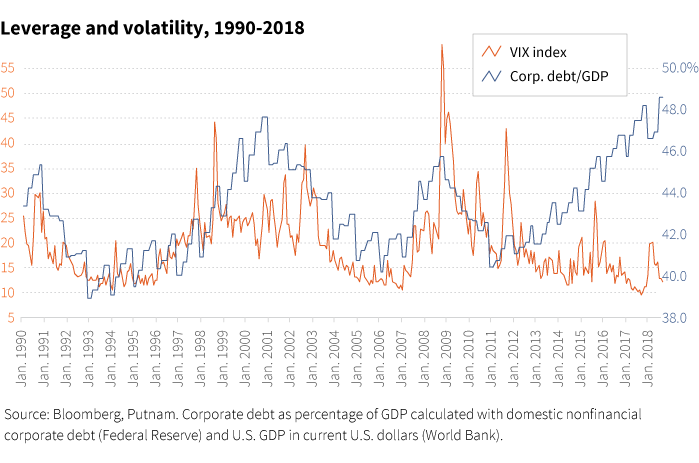
Volatility also tends to increase when the corporate debt-to-GDP ratio becomes extended:
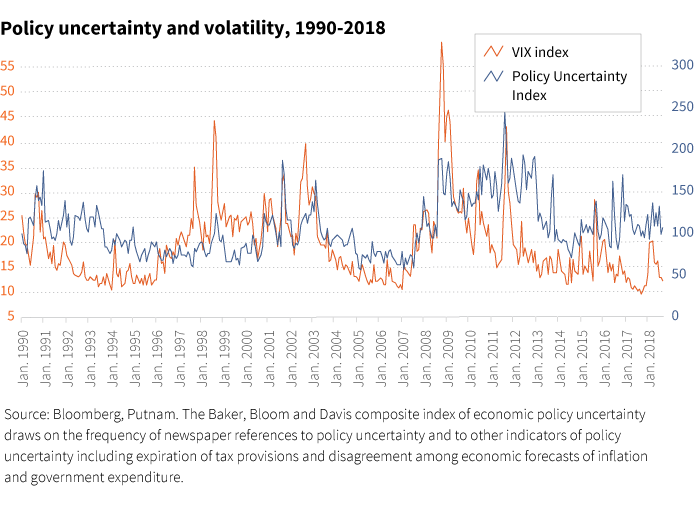
Last, volatility also often rises when there is more policy uncertainty:
Also, the current environment has a number of issues that can trigger market volatility: jittery investors, the near-decade length of the bull run, trade wars and trade-war rhetoric, a steep drop in the price of oil, and recession fears, to name a few.
315546